Real-Time IoT Dashboard
Project Overview
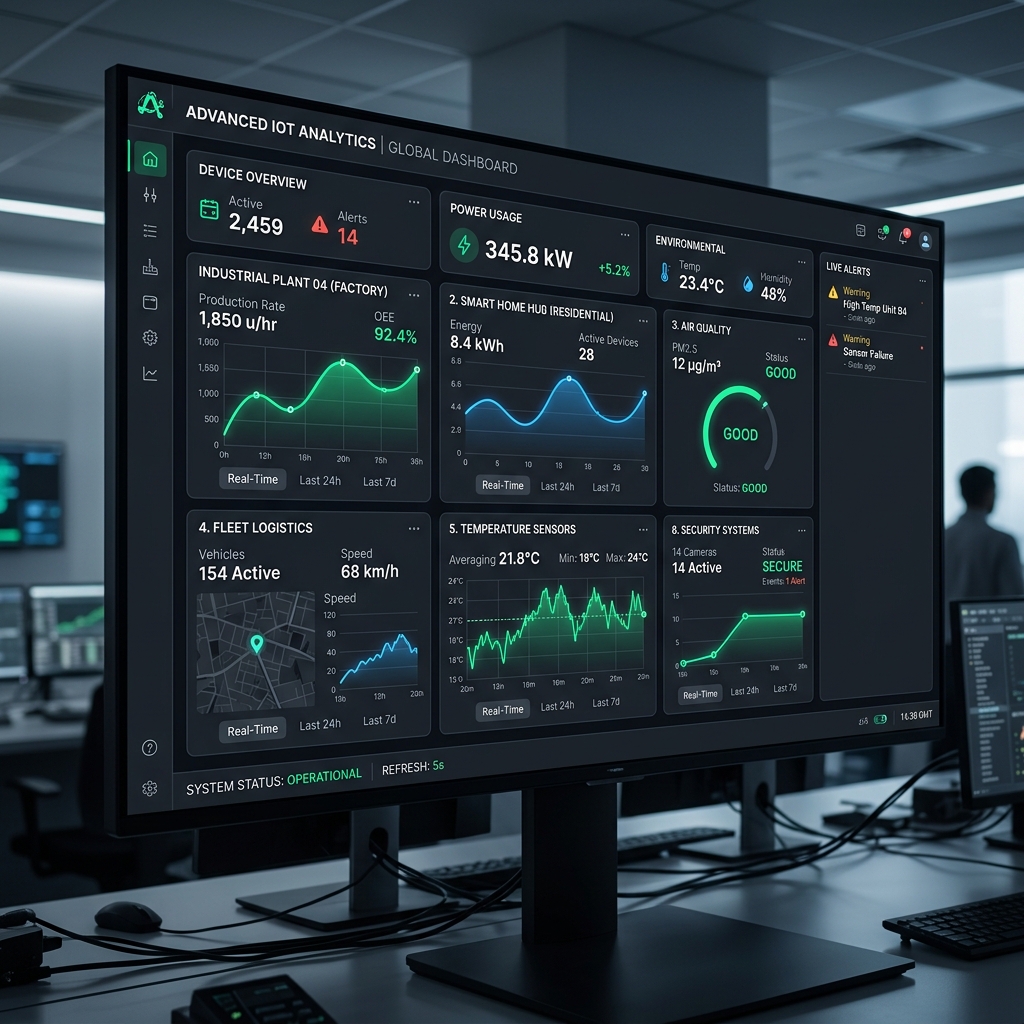
Visualizing physical data is essential for managing connected devices. The Real-Time IoT Dashboard project developed by Sreehari Viju addresses the challenge of rendering remote NodeMCU sensor telemetry instantly. By employing standard web hooks and WebSocket connections, the interface streams and displays real-time telemetry like device temperatures, motion vectors, and overall connectivity status.
Key Features & Implementation
- Interactive Charts: Visualizes historic data points using dynamic graphing tools for pattern matching and sensor trend identification.
- WebSocket Streaming: Drastically decreases latency by removing heavy HTTP request/response loops. Establishes persistent two-way device connections.
- Dynamic Layout: Fully mobile-first responsiveness, providing system administrators access to performance vitals from any viewport size.
Challenges Solved
Maintaining high-speed incoming data stream without causing browser frame drops was a complex UX and coding issue. I engineered a front-end circular buffer system that restricts active DOM updates to predefined thresholds. This reduces memory footprint and guarantees silky-smooth 60 FPS transitions.
Explore Related Projects
Discover more of our AI and robotics projects.
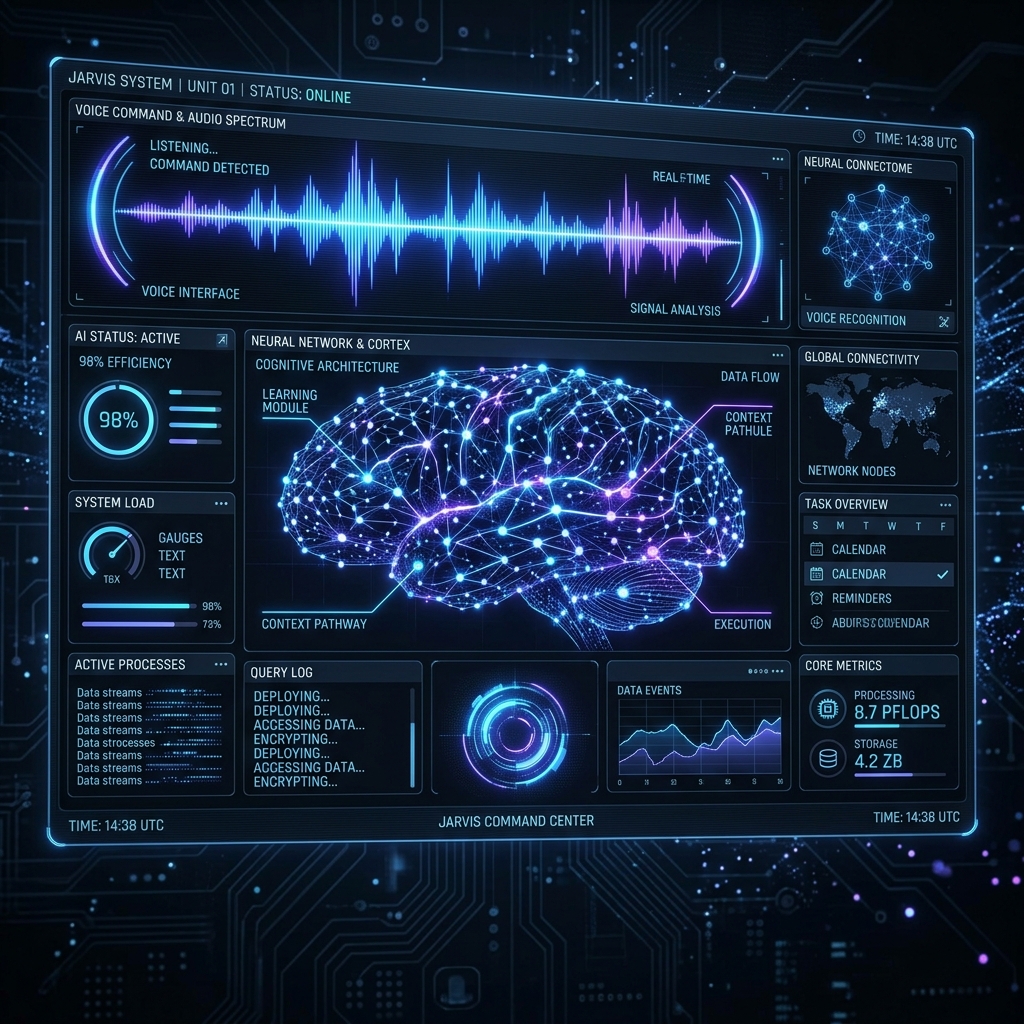
Jarvis AI Assistant
A highly intelligent voice-controlled digital companion capable of handling automated triggers and requests.
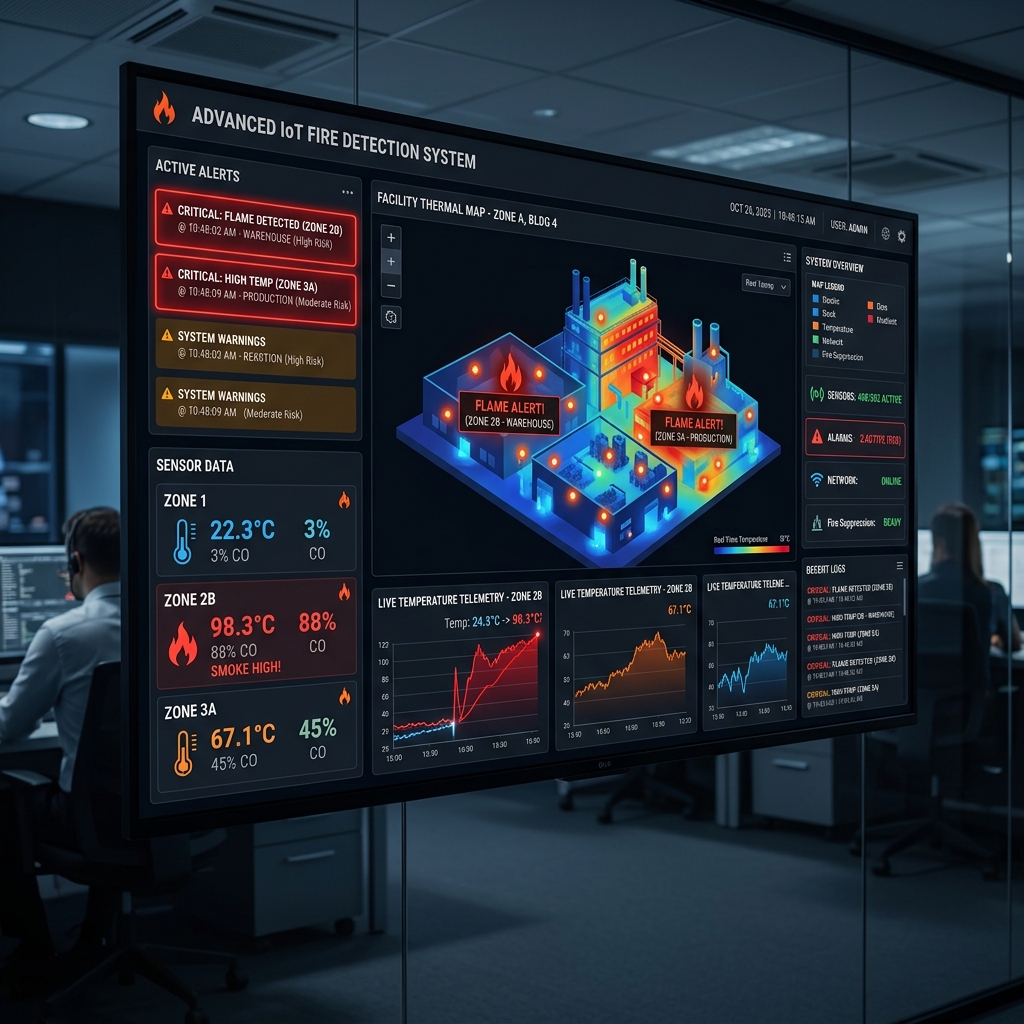
Smart Fire Detection System
Real-time emergency scanning and tracking using advanced telemetry arrays and automated NodeMCU alarms.